
In recent years, three-dimensional (3D) cell culture has become increasingly valuable in the research and development of anticancer drugs. Compared with conventional two-dimensional (2D) cell culture, 3D culture is considered to more accurately approximate the environment of the body, thus enabling more accurate evaluation of drug efficacy. In addition, because many conventional drug susceptibility tests interrupt the culture process by adding a test reagent to measure the number of living cells, such tests are not only time-consuming but also do not allow for the observation of progress over the same cells.
In 2013, Dainippon Screen Mfg. Co., Ltd. introduced the High-Speed 3D Cell Scanner Cell3iMager scanner to address these issues. This scanner uses image-processing technology to measure and analyze the growth and morphological changes over time of cancer cells cultured on the 3D culture plate, thus eliminating the need for test reagents.
In this study we used the Cell3iMager to develop a fast, easy-to-use, inexpensive, and high-throughput screening method for anticancer drugs. Using two human cancer cell lines (HEK293 and HEK293T), here we show that the area of spheroid formed in 3D culture is well correlated with the growth of cells and that anticancer drugs can be rapidly screened.
HEK293 (293) cells were generated by transformation of normal human embryonic kidney cells with sheared adenovirus 5 DNA. HEK293T (293T) cells were further transformed with SV40 virus large T-antigen. When we tested both cell lines in 3D culture, we found that 293 cells form tight, spherical and regular spheroids and 293T cells form similar spheroids with higher growth rate. Thus, we expected that both cell lines are
useful to screen anticancer drugs with Cell3iMager. In this study, we used 293 cells as cancer cells with low malignancy and 293T cells as cancer cells with high malignancy.
Standard Inhibitor Kits #1-4 were provided by the Screening Committee of Anticancer Drugs (SCADS), supported by a Grant-in-Aid for Scientific Research on Innovative Areas, Scientific Support Programs for Cancer Research, from the Ministry of Education, Culture, Sports, Science, and Technology (MEXT), Japan. These kits contain 360 compounds comprising a huge variety of molecular-targeted anticancer agents. The authors wish to express their deep gratitude for this support.
This system allows spheroid analysis by the scanning of well plates in a bright field. It calculates the number, area, and volume of the spheroids based on optical density, in the well plates without using reagents. The pixel size can be set to 10 μm, 5 μm, or 2.5 μm. If a measurement recipe has already been set, a plate can be scanned in one minute, and an automatic measurement can be completed within about 30 seconds after scanning.
HEK293 and HEK293T cells for 3D culture were seeded at a density of 500 cells in 100µl per well on a PrimeSurface® 96U plate, a 96-well ultralow-cell-adhesion plate (Sumitomo Bakelite Co., Ltd., P/N MS-9096U) with a U-shaped bottom for producing single spheroids. From Day 2 to Day 11 after seeding, spheroid growth was followed by measuring the areas of spheroids using the scanner, and by ATP quantitative assays using the living cell counting protocol (CellTiter-Glo®, Promega). All experiments were done in triplicate (n = 3).
On Day 1 after seeding, spheroid areas were measured for 3D culture. The values measured at this point were set as the values for zero hours after the agents were added. Compounds from the standard inhibitor kit were used at final concentrations of 10 nM, 100 nM, and 1000 nM. The vehicle (DMSO) was added as control.
Forty-eight hours after the compounds were added, spheroid areas were measured for 3D culture. The 50% inhibitory concentration (IC50) of each compound was calculated. Compounds that reduced spheroid areas of 293T cells in the 3D culture with a high selective manner were selected for secondary screening.
The secondary screening was performed with the same procedures used for the primary screening. In addition, ATP contents in spheroids in the 3D culture were assayed.
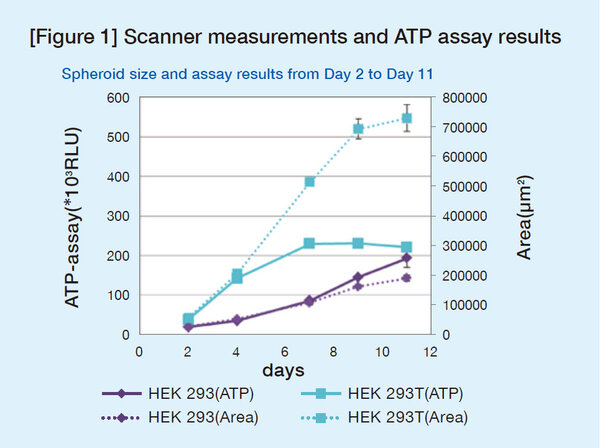
Figure 1 shows areas of spheroids measured by the scanner and the ATP assay values. High correlation between the spheroid areas and ATP values was confirmed up to Day 4 after seeding. Therefore, to screen compounds that inhibit spheroid growth, they were added on Day 1, and the areas were measured on Day 3.
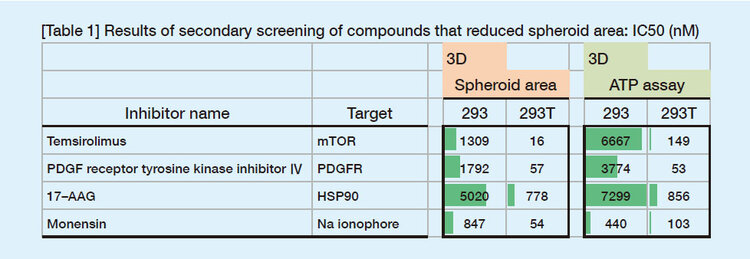
The primary screening identified 39 compounds that reduced spheroid area in the 3D spheroid culture of 293T cells. Of these compounds, 4 compounds that showed selective inhibitory activity against the HEK293T cells in 3D culture were used for secondary screening.
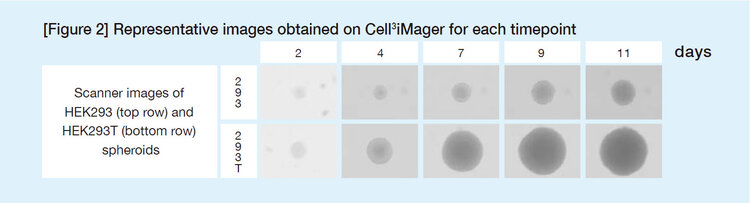
Table 1 shows results of the secondary screening. In general, the compounds that reduced spheroid area showed growth inhibition in the ATP assay. Overall, the IC50 values based on area were highly correlated with the IC50 values of the ATP assay.

, angiogenic vessels (neovasculature, sprout formation), gut model, skin models conveniently, by quantitating and monitoring the morphological changes occurring during the culture.")


